Author name: ArthVed 9X Editor

Strategies

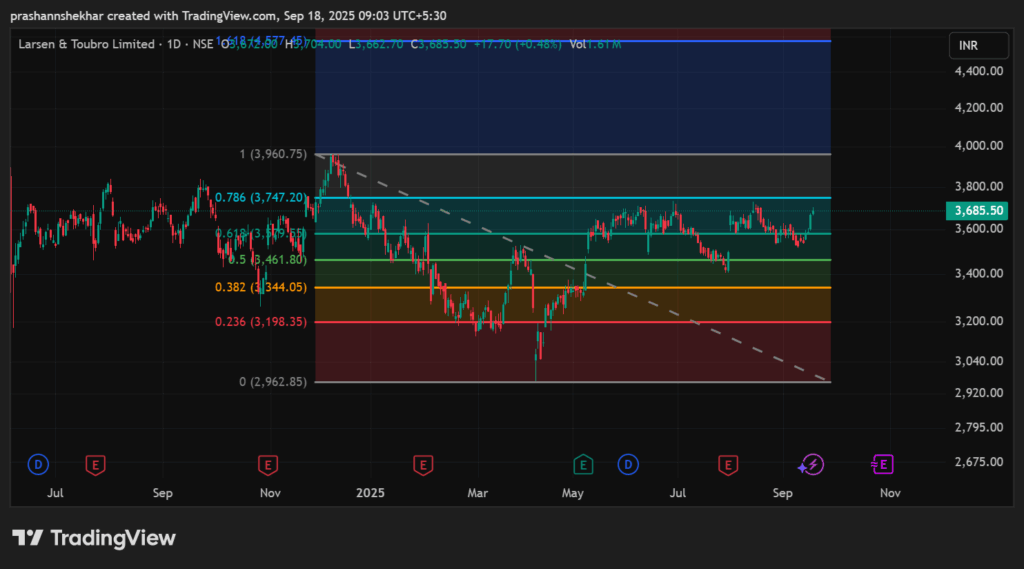
Fibonacci Retracement – Hidden Market Levels

📌 Introduction Have you ever wondered why stocks often bounce back or reverse at certain price levels? It’s not magic — it’s Fibonacci Retracement at work. Based on the famous Fibonacci sequence, this tool is one of the most widely used in technical analysis. Traders use Fibonacci retracement levels to identify potential support and resistance zones, making it a must-know concept for both intraday and swing traders. 🔹 What is Fibonacci Retracement? Fibonacci Retracement is a technical tool that plots horizontal levels on a chart, based on the mathematical ratios derived from the Fibonacci sequence. The most commonly used Fibonacci retracement levels are: 👉 These levels act as support in uptrends and resistance in downtrends. 🔹 How to Draw Fibonacci Retracement 💡 Example: If a stock rises from ₹100 to ₹200, and then starts correcting: 🔹 How Traders Use Fibonacci Levels 1. Finding Support and Resistance 2. Trend Continuation Strategy In an uptrend: In a downtrend: 3. Confluence Trading Fibonacci works best when combined with other tools. Examples: 4. Target Projection Many traders also use Fibonacci extensions (161.8%, 261.8%) to set profit targets after a breakout. 🔹 Advantages of Fibonacci Retracement ✅ Easy to plot and widely used.✅ Helps identify natural support and resistance zones.✅ Works across intraday, swing, and positional trading.✅ Powerful when combined with RSI, MACD, or Volume. 🔹 Limitations of Fibonacci Retracement ❌ Subjective — different traders may choose different swing highs/lows.❌ Levels are not guaranteed — price may ignore them.❌ Should never be used alone; confirmation is a must. 📊 Conclusion Fibonacci Retracement is one of the most reliable tools for predicting market pullbacks and continuations. By marking key retracement levels like 38.2%, 50%, and 61.8%, traders can identify high-probability support and resistance zones. 👉 But remember: Fibonacci should always be combined with other indicators, price action, and risk management. 📌 Disclaimer: This blog is for educational purposes only. ArthVed 9X is not a SEBI-registered advisor. Please consult your financial advisor before making investment decisions.

Strategies

Bollinger Bands in Trading – A Complete Guide for Beginners

📌 Introduction Markets are never still — they expand, contract, and move in cycles of volatility. To capture these movements, traders often rely on Bollinger Bands. Created by John Bollinger, Bollinger Bands are one of the most popular volatility indicators. They help traders understand whether prices are high or low relative to previous levels and identify potential breakouts, reversals, and trend continuations. 🔹 What are Bollinger Bands? Bollinger Bands consist of three lines plotted on a price chart: 👉 The bands automatically expand during high volatility and contract during low volatility. 🔹 How to Read Bollinger Bands 🔹 Popular Bollinger Band Strategies 1. Bollinger Band Squeeze (Breakout Strategy) When the bands contract tightly, it signals low volatility. This is often followed by a sharp breakout. 👉 Many intraday traders love this setup for momentum trades. 2. Bollinger Band Bounce (Reversal Strategy) In range-bound markets, the price tends to bounce between the upper and lower bands. ⚠️ Works best in sideways markets, not in strong trends. 3. Bollinger Bands with RSI Combining Bollinger Bands with RSI improves accuracy. 4. Bollinger Band Riding (Trend Strategy) In strong trends, prices “ride the band”: 👉 Don’t fight the trend if price is riding the bands. 🔹 Best Settings for Bollinger Bands 💡 Pro Tip: Adjust band settings based on stock volatility. Higher volatility = wider bands. 🔹 Advantages of Bollinger Bands ✅ Works in all timeframes.✅ Helps identify volatility shifts.✅ Useful for both breakout and reversal trading.✅ Easy to combine with RSI, MACD, or Volume. 🔹 Limitations of Bollinger Bands ❌ Not a standalone indicator — needs confirmation.❌ In strong trends, overbought/oversold signals can mislead.❌ False breakouts are common during news events. 📊 Conclusion Bollinger Bands are an essential tool for every trader’s toolkit. They help you: 👉 But remember: Always combine Bollinger Bands with other tools like RSI, MACD, or Volume for better accuracy. 📌 Disclaimer: This blog is for educational purposes only. ArthVed 9X is not a SEBI-registered advisor. Please consult your financial advisor before making investment decisions.

Strategies

RSI (Relative Strength Index) in Trading – A Complete Beginner’s Guide

📌 Introduction When it comes to technical indicators, the Relative Strength Index (RSI) is one of the most widely used tools in trading. Introduced by J. Welles Wilder, RSI is a momentum oscillator that helps traders measure the speed and strength of price movements. Whether you are an intraday trader, swing trader, or investor, understanding RSI can give you an edge in spotting trend reversals and avoiding false entries. 🔹 What is RSI in Trading? RSI stands for Relative Strength Index. It is a momentum oscillator that ranges from 0 to 100 and is used to identify: 👉 In simple words: RSI tells you when a stock is running “too hot” or “too cold.” 🔹 RSI Formula (Simplified) RSI is calculated using the average gains and losses over a selected period (commonly 14 periods). RSI=100−1001+RSRSI = 100 – \frac{100}{1 + RS}RSI=100−1+RS100​ Where RS = Average Gain ÷ Average Loss ⚡ Don’t worry—you don’t need to calculate it manually. Charting platforms like TradingView and ArthVed 9X tools plot RSI automatically. 🔹 How to Read RSI Levels 💡 Many traders also watch the RSI 60–40 range to identify bullish/bearish strength. 🔹 How to Use RSI in Trading 1. Overbought and Oversold Strategy ⚠️ But note: In strong trends, RSI can remain overbought/oversold for a long time. Always confirm with other indicators. 2. RSI Divergence Strategy RSI divergence occurs when the price and RSI move in opposite directions: 👉 Divergence is a powerful signal for early entry before the trend changes. 3. RSI with Moving Averages (Filter) Combine RSI with EMA or SMA for better accuracy. Example setup: 4. RSI Swing Rejection Strategy This advanced method looks for RSI to cross 30/70 levels and then reject back. Example: 🔹 Best RSI Settings for Traders 🔹 Advantages of RSI ✅ Easy to understand and apply.✅ Works across all timeframes (intraday, swing, positional).✅ Helps spot early trend reversals.✅ Powerful when combined with moving averages or candlestick patterns. 🔹 Limitations of RSI ❌ Can give false signals in strong trending markets.❌ Overbought/oversold does not always mean immediate reversal.❌ Best used with confirmation (trendlines, volume, support/resistance). 📊 Conclusion The Relative Strength Index (RSI) is one of the most reliable momentum indicators for traders. It helps you spot overbought and oversold conditions, identify divergences, and confirm trend strength. 👉 But remember: RSI should not be used in isolation. Combine it with Moving Averages, Support/Resistance, or Volume analysis for better results. 📌 Disclaimer: This blog is for educational purposes only. ArthVed 9X is not a SEBI-registered advisor. Please consult your financial advisor before making investment decisions.

Strategies

Moving Averages – The Foundation of Technical Analysis

📌 Introduction If there is one technical indicator that almost every trader has on their chart, it is the Moving Average (MA). Simple yet powerful, moving averages help traders smooth price data, identify trends, and filter out market noise. Whether you’re a beginner or an experienced trader, understanding moving averages is a must. In this blog, we’ll cover everything you need to know about moving averages, their types, and how to use them effectively in intraday and swing trading. 🔹 What is a Moving Average? A Moving Average is a statistical calculation that takes the average price of a stock (or any asset) over a specific number of periods and keeps updating as new data comes in. 👉 In simple words: It’s a line plotted on your chart that helps you identify the overall direction of the market. 🔹 Types of Moving Averages 1. Simple Moving Average (SMA) 2. Exponential Moving Average (EMA) 3. Weighted Moving Average (WMA) 🔹 How to Use Moving Averages in Trading 1. Trend Identification 👉 Example: Many traders use the 200-day SMA to identify whether a stock is in a long-term bullish or bearish phase. 2. Dynamic Support and Resistance Moving averages often act as support in an uptrend and resistance in a downtrend. 3. Moving Average Crossovers Crossovers are among the most popular strategies in trading. ⚠️ Works best in trending markets, but may give false signals in sideways markets. 4. Intraday Trading with EMA Intraday traders often prefer EMA because of its sensitivity to price. Example setup: 🔹 Advantages of Moving Averages ✅ Easy to use and understand.✅ Works in all timeframes (intraday, swing, positional).✅ Helps in identifying major support/resistance levels.✅ Useful in trend-following systems. 🔹 Limitations of Moving Averages ❌ Lagging indicator – always follows price.❌ Gives false signals in sideways or choppy markets.❌ Should not be used as a standalone tool – better when combined with RSI, MACD, or Volume. 🔹 Best Moving Average Settings for Traders 💡 Pro Tip: Always backtest different MA settings on your favorite stocks before live trading. 📊 Conclusion Moving Averages are the backbone of technical analysis. They not only help traders identify trends but also provide reliable support and resistance zones. However, they should never be used in isolation. Combine them with other indicators like RSI, MACD, or Volume for higher accuracy. 📌 Disclaimer: This blog is for educational purposes only. ArthVed 9X is not a SEBI-registered advisor. Please consult your financial advisor before making investment decisions.

Learnings

Getting Started in the Stock Market: A Step-by-Step Guide for Beginners

For anyone new to trading or investing, the stock market can seem overwhelming. But with the right approach, beginners can get started step by step. Step 1: Learn the basics of how the stock market works. Understand terms like shares, indices, brokers, and trading hours.Step 2: Open a demat and trading account with a trusted broker.Step 3: Start small — invest in a few companies you understand or track indices like Nifty 50 or Bank Nifty.Step 4: Learn how to read stock market charts and use simple tools like moving averages.Step 5: Practice discipline, risk management, and patience. The Indian stock market offers opportunities for everyone, but success comes only to those who treat trading as a skill to be developed — not a shortcut to riches.

Learnings

The Importance of Risk Management for New Traders

One of the biggest lessons for beginners in trading is the importance of risk management. Even experienced traders face losses — but what keeps them in the game is their ability to manage risks effectively. Risk management means deciding how much capital to put into a trade, setting stop-loss levels, and never risking more than you can afford to lose. For example, many successful traders risk only 1–2% of their capital on a single trade. Without proper risk management, even the best trading strategy can fail. Beginners should focus less on chasing profits and more on protecting their capital. The goal is simple: survive long enough in the market to learn, improve, and eventually succeed.

Learnings

Stock Market Myths Busted: What Every New Trader Should Know

The stock market is full of myths that often mislead beginners. Many people believe you need a lot of money to start trading, or that the stock market is nothing more than gambling. These stock market myths prevent traders from approaching the market with the right mindset. In reality, anyone can begin with small investments. Trading and investing are about strategy, research, and discipline — not luck. Another common misconception is that “stock prices always go up.” Markets move in cycles, and understanding those cycles is crucial. By busting these myths, beginners can approach trading with confidence, knowing that success depends on knowledge, patience, and risk management, not shortcuts or tips.

Learnings

The Future of the Indian Stock Market: Key Trends to Watch in 2025

The Indian stock market in 2025 is expected to evolve rapidly, driven by technology, global trends, and domestic growth. With India’s economy expanding and retail participation rising, markets are likely to see higher volumes and new opportunities. Key trends to watch include: While opportunities will grow, volatility will remain. Traders and investors must adapt by learning, using reliable tools, and staying updated on economic policies. The future of India’s stock market is promising, but knowledge and discipline will remain the real game-changers.

Learnings

Why Most Traders Fail in the Stock Market and How You Can Avoid It

It is a well-known fact that most traders lose money in the stock market, but the reasons are often misunderstood. Beginners usually fall into common traps such as overtrading, lack of discipline, ignoring risk management, and chasing quick profits. One of the biggest mistakes is treating trading like gambling instead of a structured process. Without a clear plan, proper research, and patience, traders often repeat costly errors. To avoid these mistakes, focus on building a trading discipline, following a strategy consistently, and managing risk properly. Most importantly, never trade based on tips or emotions. Successful traders win not because they never lose, but because they limit their losses and let their winners run. By learning from others’ failures, you can position yourself on the right side of the market.

Learnings

How to Read Stock Market Charts: A Beginner’s Introduction

Understanding how to read stock market charts is the first step for any beginner entering the world of trading. Stock charts help you visualize price movements, trends, and patterns that can guide your decisions. The most common type of chart used by traders is the candlestick chart. Each candlestick represents price movement within a specific time period, showing the open, high, low, and close price. For beginners, learning candlestick basics such as bullish candles, bearish candles, and reversal patterns is essential. Apart from candlesticks, traders also use line charts and bar charts, along with stock analysis tools like moving averages and support/resistance levels. These tools help simplify complex data into actionable insights. By learning stock charts, beginners can shift from guesswork to informed decision-making. Remember — reading charts is not about predicting the future perfectly but about improving your probability of success.

Scroll to Top