Author name: ArthVed 9X Editor

Strategies

Liquidity Sweeps & Stop-Loss Hunting: How Smart Money Traps Retail Traders Before the Real Move

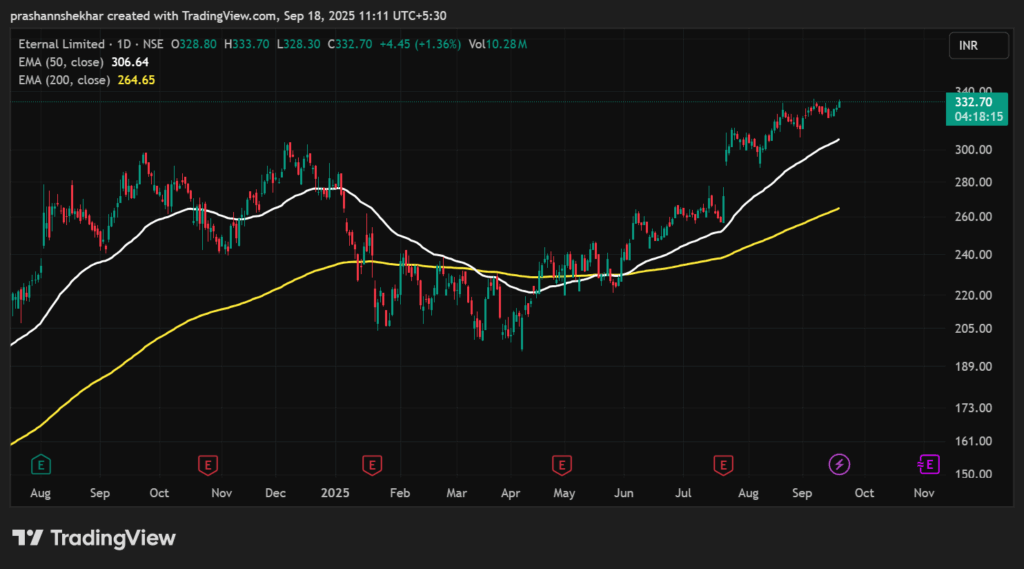
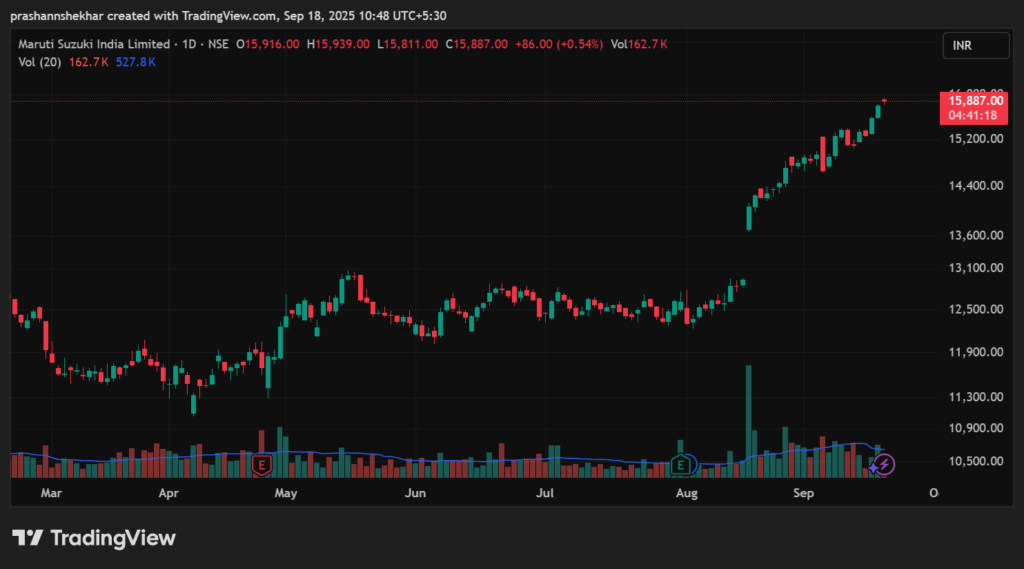
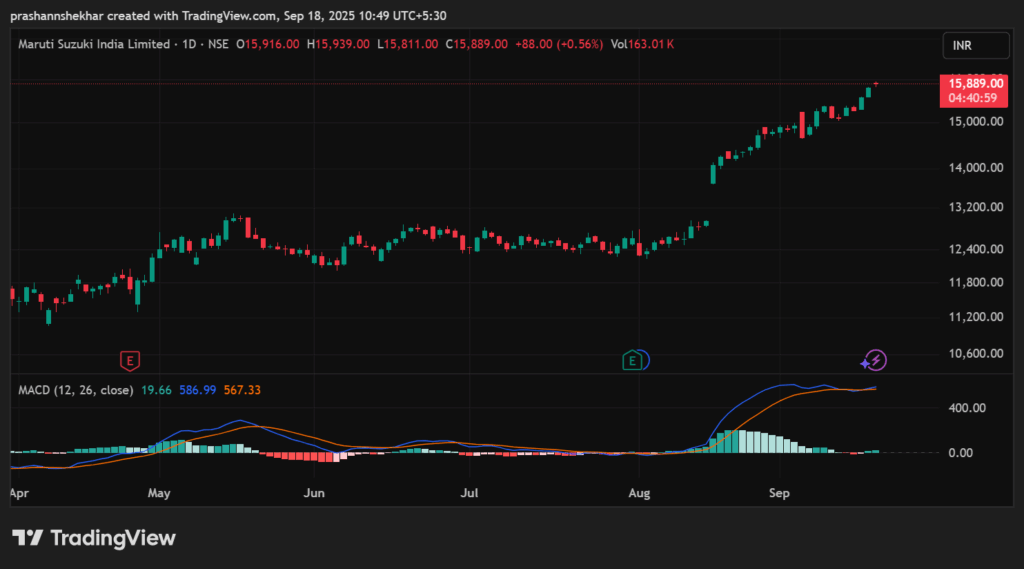
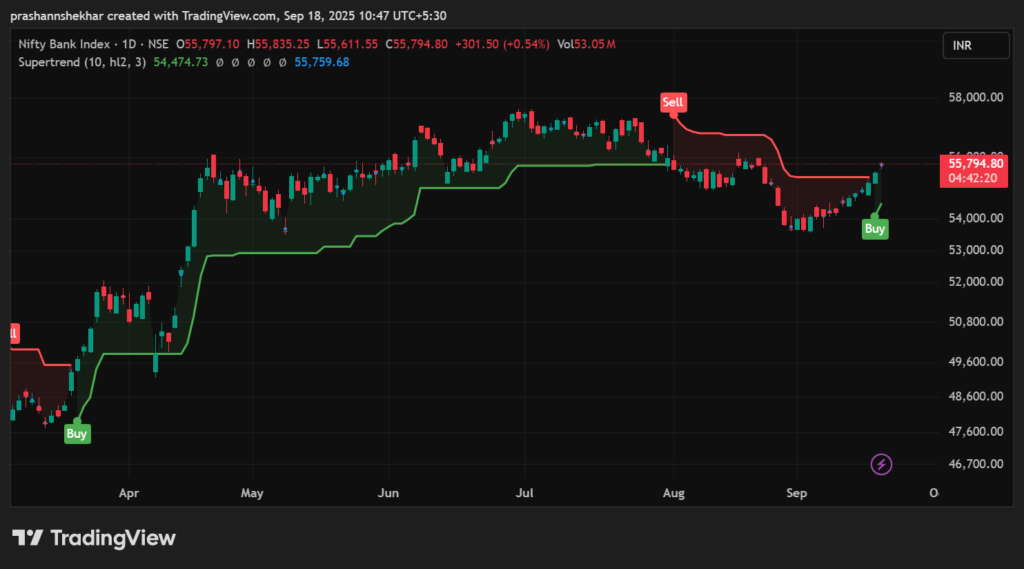
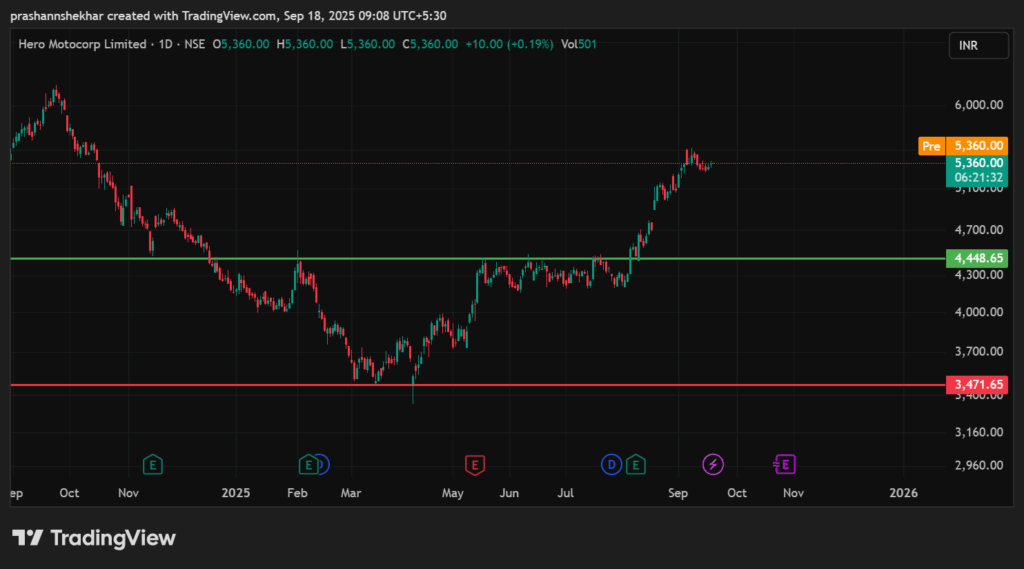
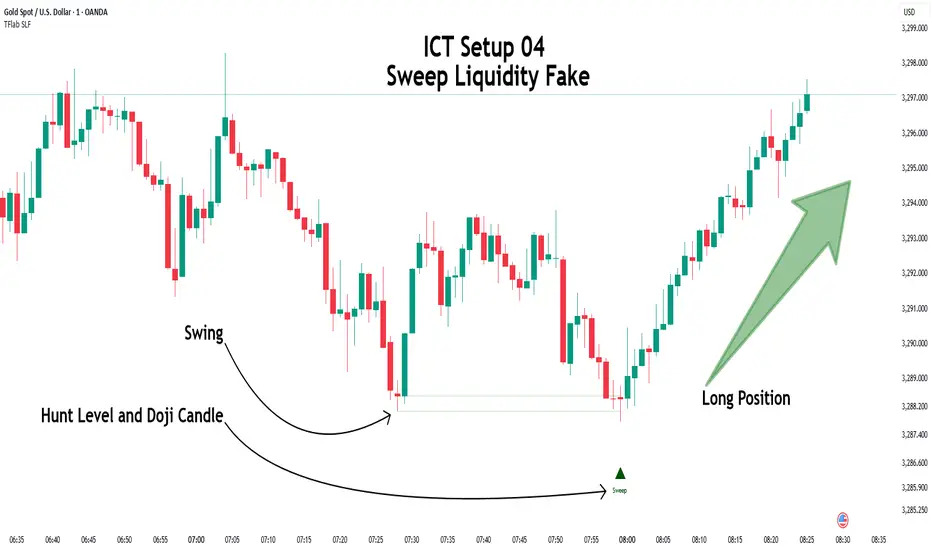
Introduction If you’ve ever placed a trade near support or resistance, only to watch price spike against you, hit your stop-loss, and then move perfectly in your original direction, you’ve likely experienced a Liquidity Sweep. This is not random. It’s a deliberate market behavior where smart money hunts retail stop-losses to collect liquidity before initiating the real move. In this blog, you’ll learn: Let’s break it down. What Is a Liquidity Sweep? A Liquidity Sweep (also called Stop-Loss Hunting) happens when the price temporarily breaks a key support or resistance level to trigger clustered stop-loss orders and pending entries then quickly reverses. Retail traders usually place stops: Institutions and large players need liquidity to enter big positions. Those retail stops are the liquidity. So price is pushed into those zones first, not to continue but to fill large orders cheaply. Once liquidity is collected, the real directional move begins. Why Liquidity Sweeps Form Near Support & Resistance Support and resistance zones naturally attract: This creates high liquidity pools. Smart money targets these areas because: βœ… Maximum orders availableβœ… Minimal slippage for large entriesβœ… Retail emotions peak here (fear & FOMO) That’s why you’ll often see: All classic signs of liquidity grabs. Typical Structure of an SL Hunt Setup A textbook liquidity sweep looks like this: This is called a false breakout with displacement. The Core Trading Idea Never trade the breakout. Trade the rejection AFTER liquidity is taken. Instead of chasing moves, wait for: Patience here changes everything. Entry Strategy Using Multiple Confirmations Liquidity sweeps alone are powerful, but combining them with indicators increases accuracy dramatically. Here’s a professional framework: Step 1 – Identify Key Support / Resistance Mark: These are your liquidity magnets. Step 2 – Wait for Liquidity Sweep Look for: βœ… Wick beyond levelβœ… Candle closes back insideβœ… Volume spike (optional)βœ… Immediate rejection No sweep = no trade. Step 3 – Add Indicator Confirmation Now combine with ANY of the following: RSI Confirmation For Shorts: For Longs: This confirms momentum reversal. EMA Crossover Confirmation Use fast EMA + slow EMA (example: 9 & 21): After sweep: This confirms the trend shift. Supertrend Confirmation After liquidity grab: This confirms trend alignment. Example Long Setup Example Short Setup Risk Management (Most Important Part) Even perfect setups fail without risk control. Use: βœ… Fixed risk per trade (1–2%)βœ… SL beyond sweep high/lowβœ… Minimum Risk:Reward = 1:2βœ… Avoid overtrading Remember: Your job is not to win every trade your job is to survive long enough for probabilities to work. Common Mistakes Traders Make 🚫 Trading every wick🚫 Entering before confirmation🚫 Tight stop inside liquidity zone🚫 Ignoring higher timeframe levels🚫 Revenge trading after sweep Avoid these, and your consistency improves instantly. Final Thoughts Liquidity Sweeps are not manipulation they are how markets function. Once you understand that price must collect orders before moving, everything changes: Combine Liquidity Sweeps with RSI, EMA Crossovers, or Supertrend, and you’ll have a high-probability system built around real market behavior, not lagging indicators alone.

News & Updates

Why Nifty IT Stocks Are Falling: Key Reasons Behind the Recent Sell-Off

Why Nifty IT Stocks Are Falling – Explained (2026 Analysis) The Nifty IT index, representing India’s leading information technology companies like TCS, Infosys, Wipro, HCL Tech, and Tech Mahindra, has recently experienced sharp declines, with multiple sessions of losses and several heavyweight stocks slipping to multi-month lows. This has raised alarm among investors and market watchers. In this blog, we break down the top reasons behind this downturn, what it means for the sector, and what investors should watch next. 1. AI-Driven Disruption Fears One of the largest triggers for the current sell-off is the fear that artificial intelligence (AI) will disrupt the traditional business model of Indian IT companies. Firms in the sector have historically relied on a labour-intensive, outsourcing-based model, billing clients for manpower deployed across projects. Recent developments – such as AI tools capable of automating tasks across legal, marketing, data processing, and operations have heightened investor concerns that billable hours and staffing demand may shrink, undermining future revenue growth. 2. Fading U.S. Rate Cut Expectations Strong economic data out of the United States, including robust job growth, has reduced market expectations for near-term interest rate cuts by the U.S. Federal Reserve. Higher or sustained interest rates tend to dampen global growth prospects, leading to slower tech spending by businesses. As Indian IT firms derive a significant portion of revenue from U.S. clients, this macroeconomic shift has weighed heavily on valuations. 3. Global Tech Market Weakness Indian IT stocks are not moving in isolation. Broader declines in global technology markets, including sell-offs in major indices like the Nasdaq and weakness in ADRs of Infosys and Wipro, have spilled over into Indian equities. These linkages reflect rising risk aversion among investors and momentum selling in technology sectors worldwide. 4. Profit Taking and Valuation Corrections After years of strong performance, many IT stocks were trading at relatively high valuations. When market sentiment shifts especially on fears of slower growth – profit booking can accelerate downturns, driving prices lower even without negative company-specific news. 5. Structural Business Model Challenges Beyond AI and macro factors, analysts point to deeper concerns about the traditional IT services model. As enterprises increasingly demand outcome-based pricing and digital transformation services instead of routine outsourcing work, Indian IT players may need to reinvent their service offerings and adapt their revenue mix. 6. Sector Rotation & Foreign Investor Outflows At times of volatility, investors often rotate capital into sectors perceived as safer or more defensive, such as banking or consumer goods, away from large tech exposures. Additionally, foreign institutional investors have been reducing exposure to risk assets, contributing to downward pressure on IT equities. What This Means for Investors The recent fall in the Nifty IT index reflects a mixture of structural disruption fears, macroeconomic shifts, and changing investor sentiment. While AI holds promise for long-term technological transformation, its current market interpretation is skewed toward threat rather than opportunity, especially for legacy outsourcing models. Understanding these forces can help investors navigate volatility and position themselves for future growth opportunities.

Analysis, IPO

Meesho IPO 2025 Explained: Valuation, Business Model, Growth Story & What It Means for Small-Town India

Meesho IPO 2025: A Breakout Moment in India’s E-commerce Story The Indian e-commerce landscape is poised for another major shake-up as Meesho, the social-commerce / value-ecommerce platform, opens its initial public offering (IPO) from 3 December to 5 December 2025. With a price band of β‚Ή105–₹111 per share, Meesho aims to raise a substantial β‚Ή5,421.20 crore through a mix of fresh issue and offer-for-sale (OFS). Of this, around β‚Ή4,250 crore is via fresh equity, while existing investors are offloading shares worth roughly β‚Ή1,171.20 crore. The minimum application for one lot is 135 shares, which at the upper band works out to β‰ˆ β‚Ή14,985. At the upper end of the price band, Meesho’s post-money valuation comes close to β‚Ή50,000–₹53,000 crore (i.e., roughly USD 5.6–6 billion). This is a landmark moment for Meesho, its investors, and perhaps even for small-town India’s digital commerce aspirations. The Business Behind Meesho: What Makes It Tick Social-commerce meets value-commerce Meesho isn’t a run-of-the-mill e-commerce store. It carved a niche by combining social commerce + value commerce + deep reach into Tier-2/3/4 towns. In essence: Meesho represents a β€œdigitally empowered Bharat” – affordable products + social commerce + deep grassroots reach. What IPO proceeds will go into Per its IPO filings, the fresh funds will be used for: Given its ambition to reach the next wave of Indian consumers, bolstering tech & logistics seems central to Meesho’s long-term plan. Valuation & Financial Health: What the Numbers Show Valuation snapshot Financial performance & profitability β€” a mixed picture Thus, while Meesho’s growth story, especially in terms of reach, user base, and order volume, looks promising, its conversion to stable profits remains a work in progress. Strengths & Opportunities: What Favors Meesho Risks & Challenges: What Could Hinder the Shine Why Meesho IPO Could Be More Than Just Another Listing – A Story of β€œDigital Bharat” What makes Meesho compelling isn’t just the numbers. It’s the narrative: a company built almost from scratch less than a decade ago, using social commerce + deep rural reach + value-first philosophy β€”now aiming to go public. Its IPO isn’t just a financial milestone, but perhaps a sign of how e-commerce in India is evolving beyond metros and urban affluence. For millions in India’s hinterlands who are shopping online for the first time, and for small sellers/resellers aiming for reach, Meesho offers a bridge. The fresh capital injection into technology, infrastructure, and logistics could help unlock that potential β€”if execution stays clean. Even for market-watchers and analysts, Meesho IPO is a test: whether β€œvalue commerce + scale + social commerce” can transform into a sustainable, profitable business at a β‚Ή50,000+ crore valuation. What to Watch After IPO: Key Metrics & Signals Post-listing, these will be key signals to track to gauge whether Meesho’s story continues to hold up: Final Thoughts: A Bold IPO for India’s E-commerce Narrative With the 3–5 December 2025 IPO window, Meesho is not merely offering shares; it is putting forward a vision: of affordable, value-driven e-commerce for a large, underserved segment of India. Its valuation reflects confidence in that vision. For a market in flux, where β€œdigital Bharat” is still taking shape, Meesho’s IPO might just become a defining chapter. But whether that vision unfolds into long-term viability hinges on execution, scalability, and economics, not just on hype. If you enjoy reading about India’s growth stories, the Meesho IPO, with all its promise and perils, is one worth watching closely.

Learnings

Muhurat Trading 2025 – Best Investing Strategies for a Prosperous Start

πŸ“Œ Introduction Muhurat Trading is one of the most awaited trading sessions in India, celebrated every year during Diwali. Traders, investors, and market enthusiasts come together to mark the auspicious beginning of the financial year. This year, Muhurat Trading 2025 will be held on 21st October 2025 from 1:45 PM to 2:45 PM. While the session lasts only one hour, it is considered extremely significant for long-term wealth creation and market positivity. πŸ”Ή What is Muhurat Trading? Muhurat Trading is a special trading session conducted by NSE and BSE on Diwali, symbolizing prosperity and good fortune. πŸ”Ή Timing of Muhurat Trading 2025 πŸ”Ή Best Muhurat Trading Strategy 2025 While the session is short, using a smart strategy can maximize your chances of long-term wealth creation. 1. Invest in Blue-Chip Stocks 2. Buy & Hold Strategy 3. Diversify Your Portfolio 4. Focus on Index Funds or ETFs 5. Small but Meaningful Investments πŸ”Ή Tips for First-Time Muhurat Traders πŸ”Ή Significance of Muhurat Trading πŸ“Š Conclusion Muhurat Trading 2025 is more than just a trading session; it’s a tradition, a celebration, and an opportunity to start your investing journey with luck and strategy. By focusing on blue-chip stocks, index ETFs, and a buy-and-hold strategy, you can make this one-hour session truly rewarding. 🌐 Start planning today and make your Muhurat Trading 2025 investment count! πŸ“Œ Disclaimer: This blog is for educational purposes only. ArthVed 9X is not a SEBI-registered advisor. Please consult your financial advisor before making investment decisions.

News & Updates

US Slaps 100% Tariff on Pharma: Is Indian Pharma Market at Risk?

In a shocking move, the United States has announced a 100% tariff on pharmaceutical imports, citing national security concerns and rising domestic production costs. While this may sound like a distant headline, its ripples are expected to be felt globallyβ€”especially in India’s pharma sector, which has long been a key supplier to the US market. Immediate Impact on Pharma Companies US tariffs of this magnitude will directly hit export revenues for pharmaceutical companies that rely heavily on the American market. Firms with significant sales to the US may face: Companies that are agile and have diversified markets outside the US may weather the storm better, but the short-term impact is likely to be negative across the board. What This Means for Indian Pharma Companies India is one of the largest exporters of generic drugs to the US. Giants like Sun Pharma, Dr. Reddy’s, Cipla, and Lupin could see a direct hit. Analysts suggest: However, some positive trends may emerge: Indian Pharma Index: The Market Reaction The Nifty Pharma Index, which tracks the performance of major pharmaceutical companies, is likely to face immediate downward pressure. Key points to watch: Investor Takeaway For investors tracking the Nifty Pharma Index or individual pharma stocks, the US tariff is a wake-up call: While this move may create short-term turbulence, long-term growth prospects for Indian pharma remain intact, driven by rising domestic demand, innovation, and exports to other regions. Smart investors will use this volatility to identify resilient stocks rather than panic sell. ArthVed9X Insight:The market reacts first, but fundamentals win later. Keep watching pharma companies’ US exposure, diversification strategy, and domestic growth plans to make informed decisions during this tariff-driven storm.

Strategies

Moving Average Crossovers – How to Spot Trend Shift Signals

πŸ“Œ Introduction One of the simplest and most effective ways to identify trend shifts in the stock market is by using Moving Average Crossovers. When two moving averages cross each other, it often signals a change in momentum. Traders use this to spot buying opportunities in uptrends and selling opportunities in downtrends. Whether you’re a beginner or an experienced trader, crossover strategies are easy to understand and widely used. πŸ”Ή What is a Moving Average Crossover? A moving average crossover occurs when a short-term moving average (fast MA) crosses over a long-term moving average (slow MA). πŸ‘‰ Example: πŸ”Ή Best Moving Average Combinations πŸ”Ή Types of Crossovers πŸ”Ή Moving Average Crossover Strategies 1. Golden Cross Strategy 2. Intraday Crossover Strategy 3. Crossover with RSI Filter 4. Crossover with Volume Confirmation πŸ”Ή Pros & Cons of Crossover Trading βœ… Advantages ❌ Limitations πŸ“Š Conclusion Moving Average Crossovers are one of the most reliable ways to detect trend shifts in the stock market. πŸ‘‰ For best results: With patience and discipline, crossover signals can help you catch major trend reversals and improve trading accuracy. πŸ“Œ Disclaimer: This blog is for educational purposes only. ArthVed 9X is not a SEBI-registered advisor. Please consult your financial advisor before making investment decisions.

Strategies

Volumes – The Fuel Behind Price

πŸ“Œ Introduction In the stock market, price tells you what is happening, but volume tells you why it’s happening.Volume is one of the most important indicators in technical analysis as it shows the strength behind price movements. Whether you’re trading intraday or holding for the short term, volume analysis helps confirm trends, spot breakouts, and avoid false signals. πŸ”Ή What is Volume in the Stock Market? Volume represents the total number of shares traded during a given time period (e.g., 1 minute, 15 minutes, daily). For example: πŸ”Ή Why is Volume Important in Trading? πŸ”Ή How to Read Volumes πŸ”Ή Popular Volume-Based Indicators πŸ”Ή Volume Trading Strategies 1. Volume Breakout Strategy 2. Volume with Moving Averages 3. Volume Divergence πŸ”Ή Pros & Cons of Using Volume βœ… Advantages ❌ Limitations πŸ“Š Conclusion Volume is the backbone of technical analysis.While price shows the direction, volume confirms the conviction behind the move. πŸ‘‰ For best results: With consistent practice, volume analysis can help you trade smarter and avoid traps in the stock market. πŸ“Œ Disclaimer: This blog is for educational purposes only. ArthVed 9X is not a SEBI-registered advisor. Please consult your financial advisor before making investment decisions.

Strategies

MACD Indicator Explained: How to Use MACD for Profitable Trading

πŸ“Œ Introduction One of the most powerful tools in technical analysis is the MACD (Moving Average Convergence Divergence) indicator.It helps traders identify trend direction, strength, and momentum shifts. Whether you’re an intraday trader or a swing trader, MACD can help you spot early trading opportunities with high accuracy. πŸ”Ή What is MACD? The MACD Indicator is a momentum and trend-following indicator developed by Gerald Appel.It is based on the difference between two exponential moving averages (EMAs). πŸ‘‰ Formula: πŸ”Ή How to Read MACD πŸ”Ή Best MACD Settings πŸ’‘ Tip: Avoid over-optimizing MACD; default settings work well for most traders. πŸ”Ή MACD Trading Strategies 1. MACD Crossover Strategy 2. MACD Zero Line Strategy 3. MACD + RSI Strategy 4. MACD Divergence Strategy πŸ”Ή Pros & Cons of MACD βœ… Advantages ❌ Limitations πŸ“Š Conclusion The MACD Indicator is one of the most reliable technical tools for traders.It helps identify trend direction, momentum, and potential reversals. πŸ‘‰ For best results: With practice, MACD can become a powerful weapon in your trading journey. πŸ“Œ Disclaimer: This blog is for educational purposes only. ArthVed 9X is not a SEBI-registered advisor. Please consult your financial advisor before making investment decisions.

Strategies

Supertrend Indicator – The Trend Companion

πŸ“Œ Introduction In trading, the trend is your best friend. But how do you know when a trend is changing? That’s where the Supertrend Indicator comes in. The Supertrend is a trend-following indicator that gives clear buy and sell signals directly on the chart. It works well in intraday, swing, and positional trading. πŸ”Ή What is the Supertrend Indicator? The Supertrend Indicator is based on Average True Range (ATR), which measures volatility. It works best in trending markets but can give false signals in sideways markets. πŸ”Ή How Does Supertrend Work? The Supertrend has two main parameters: πŸ‘‰ Formula: πŸ”Ή Best Supertrend Settings πŸ’‘ Tip: Always backtest before applying to live trades. πŸ”Ή How to Use Supertrend – Buy & Sell Signals βœ… Buy Signal ❌ Sell Signal πŸ”Ή Supertrend Trading Strategies 1. Supertrend + Moving Average 2. Supertrend + RSI 3. Dual Supertrend Strategy πŸ”Ή Pros & Cons of Supertrend βœ… Advantages ❌ Limitations πŸ“Š Conclusion The Supertrend Indicator is one of the simplest and most effective tools for traders. It helps identify the direction of the trend and gives clear entry and exit signals. πŸ‘‰ For best results: πŸ“Œ Disclaimer: This blog is for educational purposes only. ArthVed 9X is not a SEBI-registered advisor. Please consult your financial advisor before making investment decisions.

Strategies

Breakout and Breakdown Trading

πŸ“Œ Introduction Every trader dreams of catching that big move when a stock suddenly surges or falls with strong momentum. These moves usually happen during a breakout or breakdown. A breakout occurs when the price moves above a defined resistance level, while a breakdown happens when the price falls below a support level. Both are powerful signals for traders, especially in intraday and swing trading. πŸ”Ή What is a Breakout in Trading? A breakout happens when the stock price moves above a resistance level with higher-than-average volume. πŸ‘‰ Example: If Nifty has been struggling to cross 20,000 for weeks and suddenly breaks above it with strong volume β†’ breakout. πŸ”Ή What is a Breakdown in Trading? A breakdown is the opposite of a breakout. It happens when the stock price falls below a support level with strong selling pressure. πŸ‘‰ Example: If Bank Nifty is holding at 45,000 but crashes below that level with heavy volume β†’ breakdown. πŸ”Ή How to Identify Breakouts and Breakdowns πŸ”Ή Popular Breakout & Breakdown Strategies 1. Range Breakout Strategy 2. Chart Pattern Breakouts 3. Retest Strategy (Safer Entry) Many traders prefer waiting for a retest after a breakout/breakdown. Example: 4. Breakout with Indicators Combine breakouts with other indicators: πŸ”Ή Common Mistakes Traders Make ❌ Jumping in without volume confirmation.❌ Ignoring false breakouts (traps by big players).❌ Not setting stop-loss (breakouts fail often).❌ Entering late after the move is already gone. πŸ”Ή Risk Management in Breakout Trading πŸ“Š Conclusion Breakouts and breakdowns are among the most profitable setups in trading when used with discipline. By combining support/resistance, chart patterns, and volume analysis, traders can catch big trending moves early. πŸ‘‰ But remember: Not all breakouts succeed. Always manage risk with stop-loss and wait for confirmation. πŸ“Œ Disclaimer: This blog is for educational purposes only. ArthVed 9X is not a SEBI-registered advisor. Please consult your financial advisor before making investment decisions.

Scroll to Top